Porting WinMTR to Avalonia. A Fifteen-Year-Old MFC Tool on Windows, macOS and Linux
WinMTR combines traceroute and ping in a single window. Its last release is from 31 January 2011. I ported it from MFC to Avalonia and .NET 10, keeping the tool and dropping the platform. The result, winmtr-remaster, is my entry in the Avalonia Port Challenge.
People often say that network tools on Windows never caught up with Unix. That is mostly true. WinMTR is the exception, and it also shows the problem: it is very useful, and it has not had a release in fifteen years.
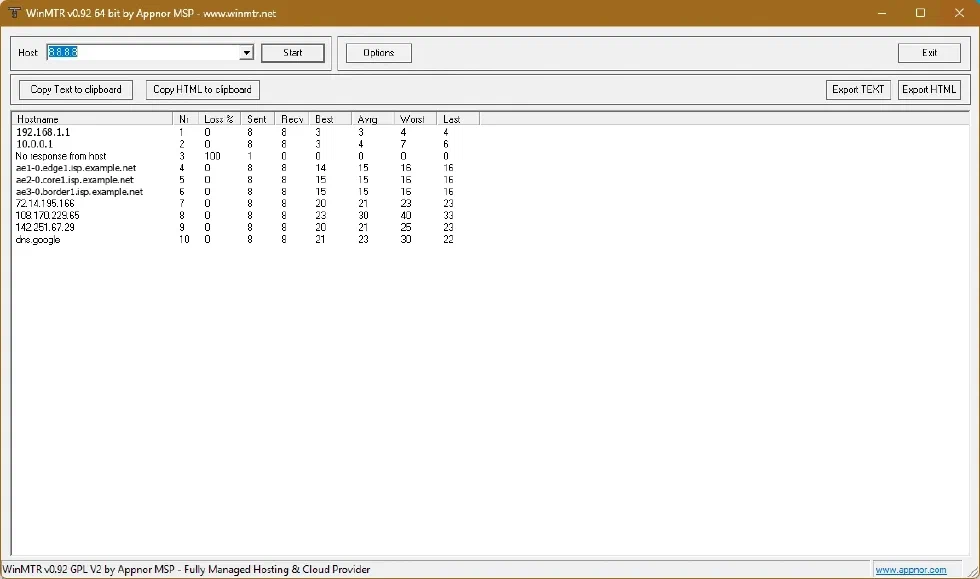
WinMTR implements MTR, Matt’s Traceroute. It finds every hop on the path and then keeps pinging each one. Therefore, one window tells you which hop loses packets. You do not need a traceroute for the path and a separate ping for the endpoint. When a customer tells me “the site is slow from the office”, this is the first tool I open.
The network logic still works, but everything around it is Windows-only. WinMTRNet.cpp calls IcmpSendEcho from ICMP.DLL, the dialogs use MFC, and the settings live in the registry under HKCU\Software\WinMTR.
Unfortunately, the machines I diagnose from are not all Windows anymore.
So the question is simple: what must change in a fifteen-year-old MFC app to run the same tool on Windows, macOS and Linux? And what else should we fix while we are there?
Reading the Original
Initially, I read the old sources. The core is WinMTRNet.cpp, about 450 lines. It keeps a fixed array of hops, struct s_nethost host[MaxHost], with counters like addr, xmit, returned, best, worst and name. The size comes from one line: #define MAX_HOPS 30.
A trace starts thirty threads with _beginthread, one per TTL. Each thread loops on IcmpSendEcho. A separate DnsResolverThread starts whenever a new address appears.
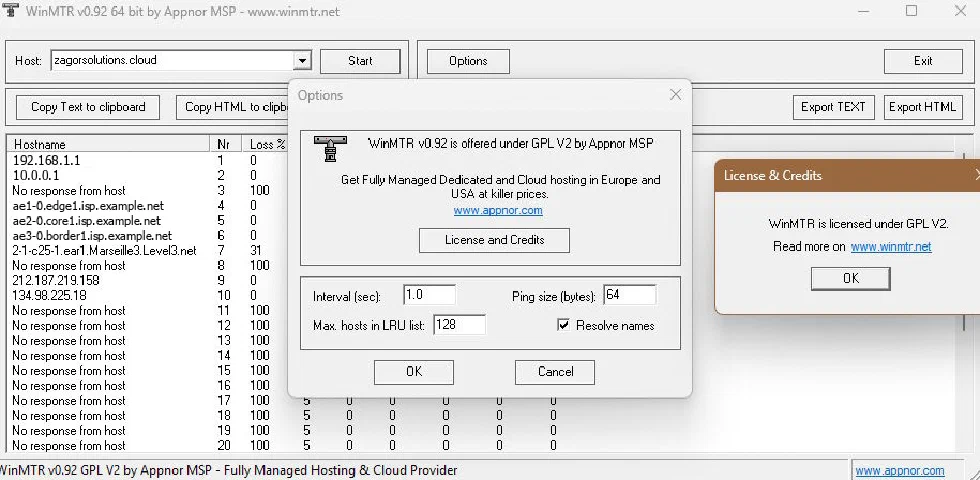
That design made sense in 2011, but every limitation comes from it. A five-hop route still costs thirty threads. The table always shows thirty rows, and the empty ones say No response.. Therefore, a short healthy path looks like a long broken one.
The dialogs are the other half. WinMTRDialog.cpp handles the grid, the timer and the trace lifecycle in 1,200 lines. WinMTROptions.cpp holds the settings fields, and WinMTRProperties.cpp is the hop detail popup.
The real problem is that the window and the tracing code depend on each other. WinMTRDialog starts traces, updates the table and saves settings. WinMTRNet sends probes, but it also reads settings from the dialog. We cannot reuse the tracing code in a console app without cutting that link first.
There are smaller bugs too. A failed probe may overwrite the hostname with an error message. DNS lookups have no cache and no timeout. SetWorst does not even store the value it receives.
Therefore, we split the remaster into three parts: the tracing rules, the operating-system calls, and the user interface. The engine talks to the machine through two small interfaces. So the same engine runs in a window, a terminal or a test.
The Domain Language
Before writing any class, we wrote a glossary in CONTEXT.md. It defines the words we use in the code.
The old code names things after how they are stored. host[i] is a hop because it sits at index i. A hop is empty when addr == 0. These names cannot express what the tool actually does, so the logic hides in scattered if checks.
Therefore, we gave each idea a name. A silent hop never replied. Trailing silence is the run of silent hops after the last one that answered. The hop limit is the highest TTL we probe, the route length is how many hops we show, and the active extent is the range we probe right now. MAX_HOPS was doing the job of all three.
Each glossary entry also has an Avoid list, such as max rows, filler rows and tick. It stops the old words from creeping back.
The most useful term was the route snapshot: a read-only copy of the whole route at one moment. The engine publishes a new snapshot on every update. Since a snapshot never changes, nothing reads the engine while it writes, and the UI never sees half-updated data. That one idea removed most of the locking the original needs.
The project layout follows the language. WinMtr.Core holds the domain and knows nothing about sockets. WinMtr.Infrastructure holds the code that talks to the machine. Only two interfaces connect them.
DNS got simpler too. The original started a new thread per address and blocked it in gethostbyaddr with no timeout. CachingNameResolver keeps a cache of 4,096 entries per session, remembers failed lookups, and never retries on a timer. So DNS never slows down the trace.
A Console Front-End Before a Window
Next, before any Avalonia work, we built WinMtr.Console with System.CommandLine.
The engine runs many probes at once, and that is hard to debug through a window. The CLI prints each snapshot as text, so we can compare runs when something looks wrong.
winmtr-cli example.com --interval 1 --hop-limit 30 --numericIt also forced the API to work for more than one app. Tracer.CreateTraceAsync returns a PreparedTrace with the resolved Target, the detected ProbeCapabilities and an IAsyncEnumerable<Route> of snapshots.
using var cancellation = new CancellationTokenSource();
CancellationToken ct = cancellation.Token;

Console.CancelKeyPress += (_, args) =>
{
    args.Cancel = true;
    cancellation.Cancel();
};

var tracer = new Tracer();
try
{
    PreparedTrace trace = await tracer.CreateTraceAsync("example.com", ProbeSettings.Default, ct);

    await foreach (Route snapshot in trace.Snapshots.WithCancellation(ct))
    {
        Console.WriteLine(new TextReportRenderer().Render(snapshot));
    }
}
catch (OperationCanceledException) when (ct.IsCancellationRequested)
{
    // Ctrl+C stops the trace.
}
The CancellationTokenSource lets us stop the trace. Its token, ct, carries the stop request when we press Ctrl+C.
Parsing, validation, DNS and the capability check all finish before the first snapshot. Hence, any of these failures shows up as an exception in one place, not as a broken row later.
What Changed From the Original App
I wanted the tool to feel familiar, but some behaviors had to change. We wrote the route and report changes down as architecture decision records in docs/adr/. The error model lives in CONTEXT.md.
Routes grow instead of being padded. A snapshot stops at the last hop that replied, so a five-hop path shows five rows. The hop limit stays as a ceiling, 30 by default and between 1..255, because a TTL is one byte. Underneath, the engine starts with 8 TTLs and adds 3 at a time as replies arrive. A short route now needs a handful of workers instead of thirty threads. A fifteen-hop route settles in about four rounds instead of fifteen. See ADR 0001 and ADR 0002.
Errors no longer replace hostnames. In the original, a failed probe writes its error into the name column. We keep the address and the name, and store the error separately as a ProbeErrorReason. So you see both which router replied and what went wrong on the last try. The terms are in the domain glossary.
Reports gained CSV and JSON. The original exports text and HTML. We kept both, and added CSV for spreadsheets and JSON for other tools. The text report still uses fixed-width columns, so it pastes cleanly into a support ticket. The remaster adds a Status column, so its reports do not match the old ones exactly. ADR 0004 allows that.
Native AOT is a requirement. I wanted the app to start fast and run without installing .NET. Native AOT compiles the code to native before we ship it, not when it runs.
ADR 0007 applies this to both the desktop app and the CLI. Therefore, every library, binding and JSON call must stay AOT-compatible.
Here is the same code published twice on the same PC, once with Native AOT and once with the default JIT:
| Measure | Native AOT | JIT | Change |
|---|---|---|---|
| Desktop: window appears (median of 5 warm starts) | 236 ms | 1,397 ms | 5.9x faster |
| Desktop: first cold start | 518 ms | 3,261 ms | 6.3x faster |
| Desktop: working set 3 s after start | 84 MB | 127 MB | 34% less |
| Desktop: what ships | 4 files, 41.8 MB | 225 files, 106.5 MB (self-contained) | 61% smaller |
CLI: --help start to exit (median of 21) |
29 ms | 141 ms | 4.9x faster |
| CLI: working set 4 s into a trace | 11.9 MB | 33.4 MB | 64% less |
| CLI: what ships | 1 file, 3.4 MB | 20 files, 0.7 MB plus the .NET runtime | no runtime needed |
The numbers justify the requirement. With JIT, the self-contained desktop build still needs 3.3 s for its first start. With Native AOT, the window appears in a quarter of a second, and the CLI starts in 29 ms with no runtime installed.
The fair comparison, though, is against the original. We rebuilt the MFC v0.92 sources with today’s compiler and ran them on the same PC. The window appears in 0.17 s for MFC, 0.20 s for AOT and 1.40 s for JIT. Idle memory is 21 MB for MFC and 83 MB for AOT, and the download is 2.1 MB against 16 MB.
So MFC still wins on size, by a wide margin. What the port buys is different: AOT almost matches the old start-up time, and the same code runs on Windows, macOS and Linux.
Tests run without opening windows. I wanted to run the tests often, without windows popping up and stealing focus. Most tests use fake network replies and a controlled clock. The UI tests use Avalonia’s headless host to load views and check bindings. So the tests are fast and do not need a live network.
Headless testing is a test-suite convention, not an ADR. ADR 0008 later records the move to Avalonia 12 and its xUnit.net v3 test host.
The Avalonia Front-End
I had wanted to build an Avalonia app for a long time. A tool with one live grid and one settings dialog is a good first one.
For MVVM I chose CommunityToolkit.Mvvm over ReactiveUI. The source-generated [ObservableProperty] and [RelayCommand] do not require learning Rx. They also work with IsAotCompatible=true, where ReactiveUI has historically struggled with trimming.
For the look I kept the stock FluentTheme. I tried FluentAvalonia first, but its AppWindow broke the headless test host. Instead, the Fluent look comes from two ColorPaletteResources entries, a Mica backdrop, and the system font with Inter as a fallback. The original was a plain Windows dialog, so a native Windows 11 look is its natural successor. The window also follows the system light or dark setting.
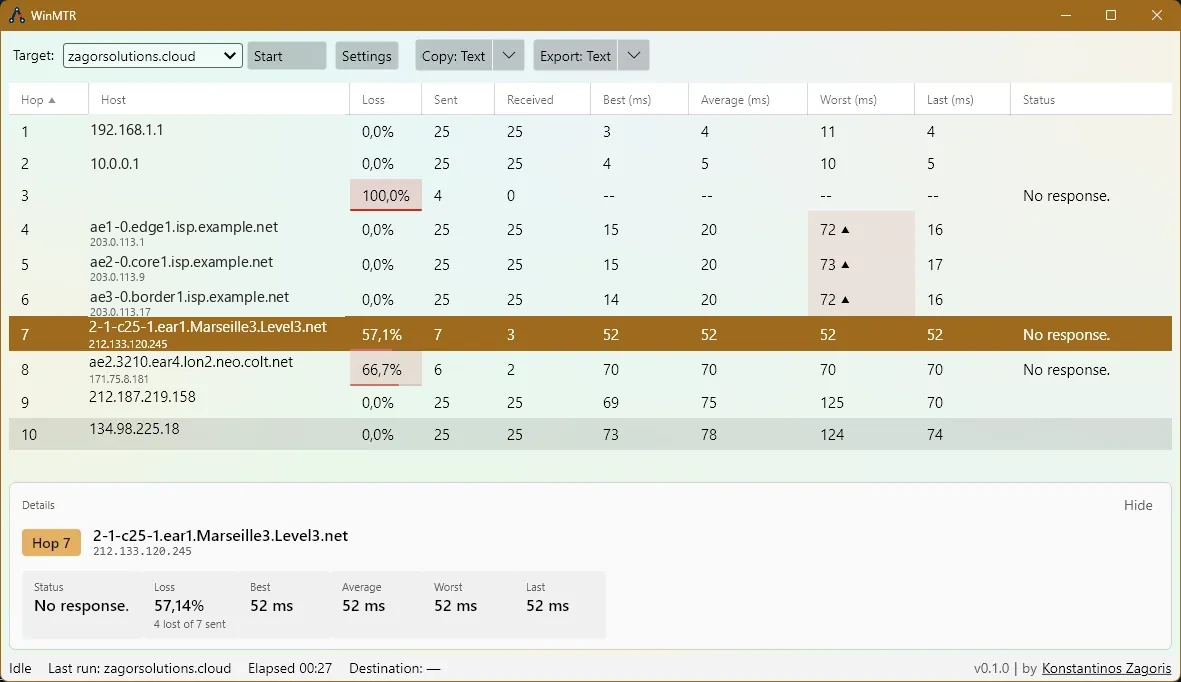
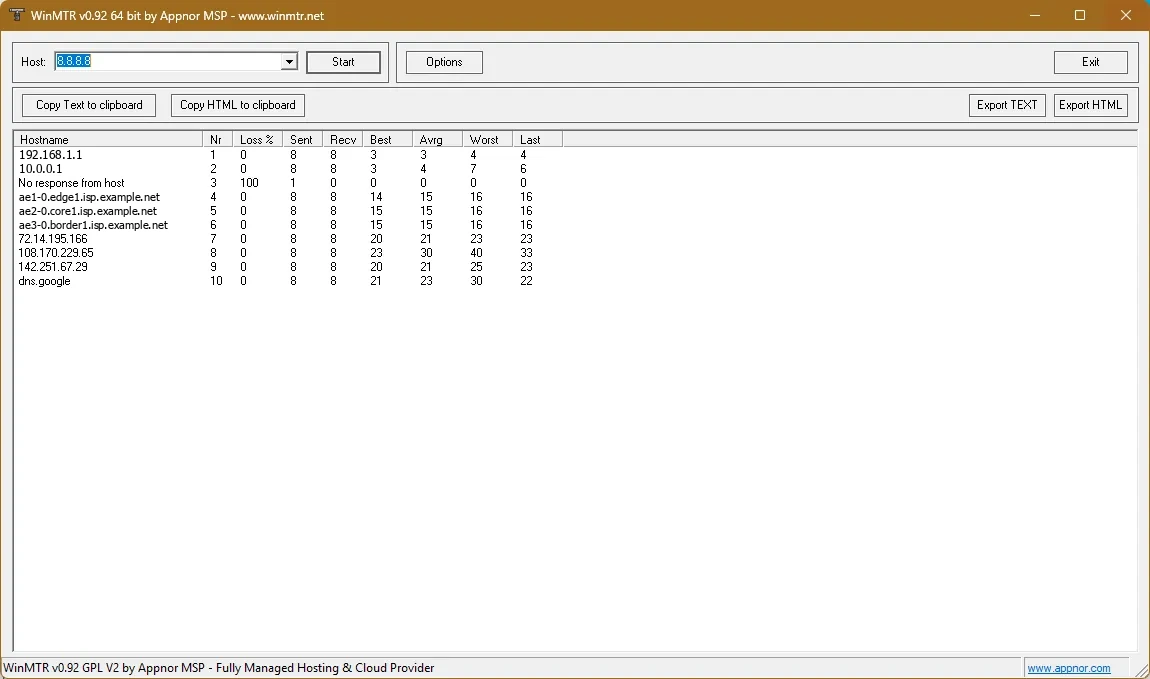
The interesting part is how the grid handles snapshots. The easy option is to rebuild the ObservableCollection on every update. Instead, we keep one ObservableCollection<HopRowViewModel> indexed by hop, and update it: change rows in place, append new hops, and keep rows that later snapshots drop.
for (int i = 0; i < hops.Length; i++)
{
if (i < Rows.Count)
UpdateLiveRow(Rows[i], hops[i]);
else
Rows.Add(CreateRow(hops[i]));
}

// Retained hop rows (ADR 0003): a row that has appeared stays for the
// session; rows beyond the current snapshot are marked, not removed.
for (int i = hops.Length; i < Rows.Count; i++)
Rows[i].IsFrozen = true;
This costs a loop and some change notifications, but each row keeps its identity. So selection and scroll position survive every update. That matters, because the hop details pane follows the selected row.
Keeping old rows is a deliberate change from the original. Snapshots drop trailing silence, so the route can shrink as well as grow. A row vanishing under the mouse feels like a bug. Therefore, the grid keeps every row it has shown for the session, in muted text. Of course, this only affects the window. Exported reports stay trimmed, so the window may show a few extra rows at the end.
The grid also highlights packet loss and slow replies. A cell with packet loss gets a colored background and a small bar under the number. A slow reply gets a colored background and a ▲ marker, so color is not the only hint.
We only flag a reply as slow after at least three replies. It must be at least 2.5 times the hop’s average and at least 20 ms above it. For example, with a 10 ms average, a 30 ms reply is flagged but a 25 ms reply is not. The rule lives in WinMtr.Core, so we can test it without a window.
The TraceSession class starts and stops traces for the desktop app. An invalid target, a failed DNS lookup and a capability-check timeout each need their own message. Keeping this out of the window lets us test it without loading Avalonia.
The non-integration suite has 759 test cases across the core, infrastructure, console and desktop projects. They use fake replies or local data, so they run without network access. Tests that send real ICMP packets are separate and skipped by default.
The Cross-Platform Journey
The same network code does not get the same permissions everywhere. On Linux and macOS, sending a custom ICMP payload may need elevated privileges. This matters when the user changes the packet size in Settings.
Before tracing, InitializeAsync sends a test probe to the local machine. If the custom payload is rejected, the app checks that the default one works and reports PayloadSupport.Restricted. If the check times out, it reports Undetermined, because no reply tells us nothing. Either way, tracing continues with the default payload.
The window explains this in a short banner. On Linux it points to setcap cap_net_raw+ep, and on macOS it suggests running with elevated privileges. The user may keep tracing with the default size or grant the permission.
Unfortunately, there is a bigger issue. Unprivileged Ping on Unix may not report the router’s address when the TTL expires, and that address is the whole point of a traceroute. I do not consider this solved. The app tracks it as a Pending state that only a real observation may settle. I want to test it on real distributions before the README promises anything.
Making WinMTR Feel at Home on macOS
On macOS, we package the app as WinMTR.app, with its icon, metadata and native libraries inside. There are separate builds for Apple Silicon and Intel. ADR 0009 covers the bundle, signing and macOS CI.
The app also has a native menu bar with About, Preferences, report commands and standard text editing.
Closing the main window stops the trace but leaves WinMTR in the Dock, like other Mac apps. Clicking the Dock icon opens a new window, and Quit ends the app. A ShellLifetimeCoordinator makes sure Close and Quit never start two shutdowns at once.
For the look, we kept the same views and view models and added a macOS theme. It changes the toolbar, menus, row striping and Details pane. A platform profile, chosen at startup, turns on the Mac theme, menus and lifetime together. The tracing engine does not change.
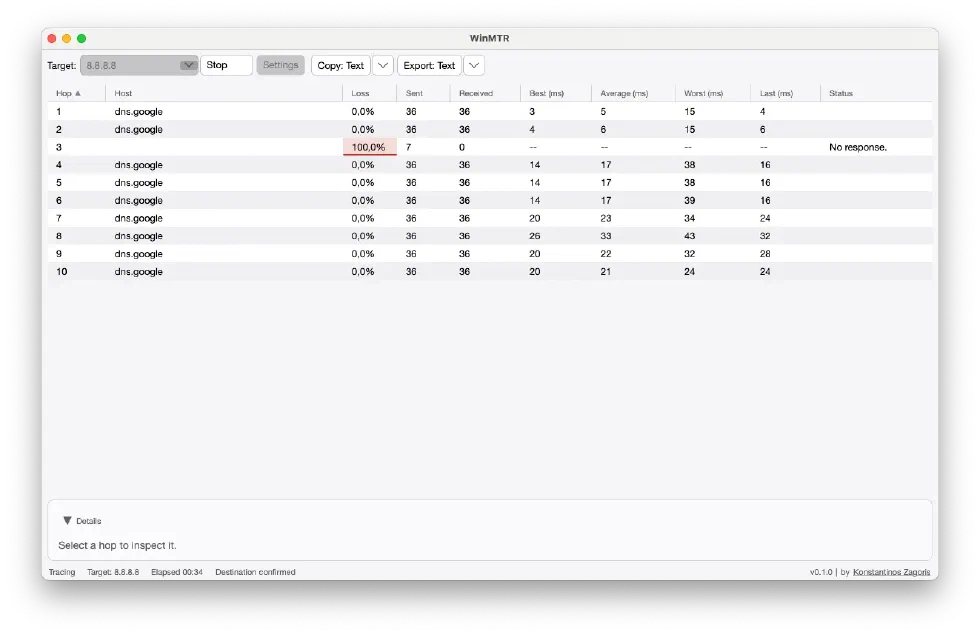
The bundle is ad-hoc signed. That checks its integrity, but it does not prove who published it. It is not Developer ID signed or notarized, so Gatekeeper may still block a downloaded copy.
Settings Without the Registry
The original keeps its settings and host list in HKCU\Software\WinMTR. That is one API call on Windows and does not exist on Linux or macOS, so it had to go.
Settings are now two JSON files in a WinMTR folder under Environment.SpecialFolder.LocalApplicationData: settings.json and history.json. They are written at different moments, so a damaged host list never costs you your settings.
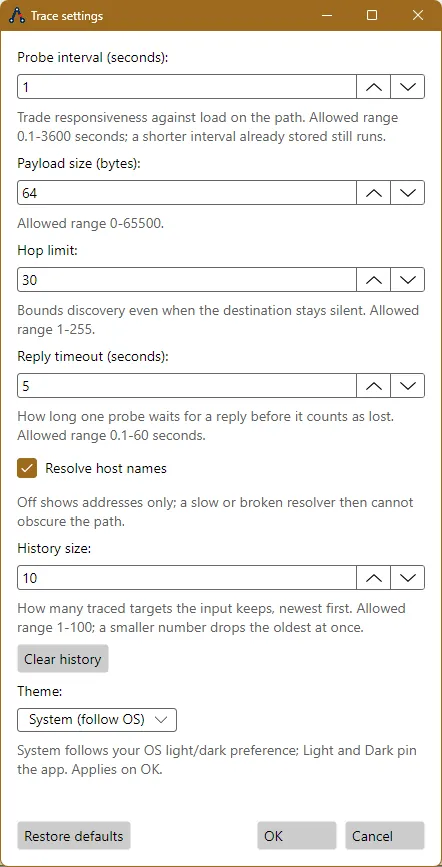
Each save writes a temporary file first and then moves it over the real one. A power cut in the middle cannot leave a half-written file, and it costs two extra lines.
AOT affects this code too. Reflection-based JsonSerializer is not trim-safe, so both files use a source-generated JsonSerializerContext. Adding a new setting means updating the context as well as the record.
Finally, there is a one-time import. On Windows, if no remaster file exists yet, the app reads the old registry key once and uses those values. It never writes back, so both versions may live side by side and the original keeps working.
Shipping Native AOT on Five Targets
The release uses four build machines for five targets. Native AOT cannot cross-compile between operating systems, but it can between CPU types on the same one. So one macos-latest runner builds both Mac binaries. Each job also runs the tests on its own platform, so Windows-only and Linux-only code gets tested where it runs.
The weak spot is the grid. Avalonia.Controls.DataGrid is not fully trim-safe and reports IL2104 and IL3053. Therefore, the project silences those two warnings for the AOT build and smoke-tests the published app after every Avalonia upgrade.
Installation
Download the archive for your platform from the releases page. There are builds for win-x64, linux-x64, linux-arm64, osx-x64 and osx-arm64. Extract it and run winmtr for the desktop app on Windows or Linux, or winmtr-cli for the terminal. You do not need to install .NET.
On macOS, pick osx-arm64 for Apple Silicon or osx-x64 for Intel. Move WinMTR.app to Applications and open it from Finder. Keep the bundle intact, because the app needs the libraries inside it.
If Gatekeeper blocks a download you trust, you may clear the quarantine flag:
xattr -dr com.apple.quarantine /Applications/WinMTR.appThe Windows binaries are not signed either, so SmartScreen may warn you. For a download you trust, choose More info and then Run anyway. To build from source, you need the .NET 10 SDK:
git clone https://github.com/kzagoris/winmtr-remaster.git
cd winmtr-remaster
dotnet run --project src/WinMtr.Desktop
The code stays under GPL v2, like the original.
Altogether, I think the main lesson of this port is that very little of the work was network code. Swapping IcmpSendEcho for System.Net.NetworkInformation.Ping took an afternoon. The real work was in the fixed array, the registry key, the dialog that ran everything, and the error written into the hostname column. Naming the domain first is what made those problems visible, and I would start there again. Of course, that assumes the original code is readable enough to serve as the specification.